A few weeks ago, Blake Lovell tweeted out a few interesting stats from the past few years in the SEC:
Random SEC basketball stats thread for those who get bored in the offseason. Let’s start with the top seven teams in overall wins the past five seasons:
— Blake Lovell (@theblakelovell) April 15, 2020
UK - 140
Auburn - 110
Florida - 108
Tennessee - 105
Arkansas - 103
South Carolina - 102
Miss St - 98
That gave me the idea to take it even further and look at similar stats for all of the 2000s. There were already interesting observations in his original thread, and I figured there would be other trends when I extended it back to the 1999-2000 season and I’d like to think I was right.
I went back and looked at regular-season wins, conference wins, SEC tournament wins, NCAA Tournament wins, and all postseason appearances. I originally planned to use some more creative graphics to convey the data, but most things got pretty convoluted, so I opted to just use basic charts with shades of red/green to show most of the data.
Regular Season Wins
The first and most obvious measure of success over time are regular-season wins. While regular-season wins certainly don’t perfectly reflect the strength of schedule for each team, it’s interesting to see the ups and downs for each team throughout the millennium.
Each season has it’s own color scale where the lowest amount of wins are in the darkest red while the most wins are the darkest green.

The first thing that I noticed is that only Kentucky and Florida have had consistent success throughout the last 20 years with the Gators’ worst year being 15 wins and the Wildcats’ worst year being just 18 wins.
Alabama’s consistency has been very impressive by getting between 16-18 wins in the regular season 11 out of the 21 years, including each of the last six.
The last three years for Vanderbilt have counteracted the success from 2007-2012 and have pulled the average down more than a full win compared to the first 18 years of the 2000s.
On the other hand, the success of the last three to four years for Auburn has started to salvage abysmal records throughout most of the period.

The reign at the top for Kentucky and Florida is more apparent when looking at the totals over the last five, ten, and 21 years.
Also of note, Arkansas has quietly had quite a bit of success in the regular season as they jump from eighth in overall wins since 2000 to third and fourth over the last ten and five years respectively.
The only teams to trend up over the three samples are Auburn and South Carolina while the only teams to trend down over the three samples are Alabama, Florida, Missouri, and Vanderbilt.
While Alabama’s consistency was pretty apparent with almost identical amounts of wins in more years, when looking at the average wins per year over the three sample time frames, LSU is also very consistent with just 17.8, 17.8, and then 18.4 wins per year as the time frame shrinks.
Regular Season Conference Wins
While regular-season wins are a good indicator for all the teams, including Missouri and Texas A&M before they joined the SEC, it’s better to compare the SEC teams against each other directly by looking at conference wins over the same period.

Most of the observations from the regular-season wins overall hold for conference wins as well. Kentucky and Florida are still at the top and Alabama is still very consistent.
If anything, Kentucky’s dominance is even more apparent when looking at just conference wins. The Wildcats had or tied for the most wins in the conference ten of the 21 years and never finished below 0.500 in the SEC.
Vanderbilt is the only team to go winless since 2000, but LSU makes up three of the eight two-win conference seasons in the same period.

Kentucky has had a nice amount of wins over the last five years.
South Carolina has had even more success in conference games than the season overall which is good for third-most wins in the SEC over the last five years including a 29 win improvement compared to the previous five years.
Auburn also has more wins in the last three years than they had in the seven years before that combined.
Despite the three good recent years, Auburn still has fewer SEC wins over the last ten years than Texas A&M does, despite the Aggies only being in the SEC for eight of those years.
SEC Tournament Wins
Because of the SEC Tournament byes and now double-byes, this chart isn’t the best indication of overall success in the tournament, but it still indicates the winners (in bold) and can give a sense of which teams show up in a comparable tournament scenario.
I also didn’t include any wins from the very brief 2020 SEC Tournament.

The SEC Tournament has not been kind to Arkansas, Auburn, Ole Miss, South Carolina, or Vanderbilt as each team has gone winless in ten or more seasons over the last 20 SEC Tournaments.
In the last 20 years, there have only been eight unique SEC Tournament winners with Kentucky taking home nine titles, Florida winning four, Mississippi State with two, and then Arkansas, Auburn, Georgia, Ole Miss, and Vanderbilt each winning once.
By almost always getting at least one win, Alabama has managed to be in the top five for total SEC Tournament wins in each of the three periods, despite also never winning more than two games since 2000.

Auburn has been boom or bust over the last decade. The Tigers finished 8 of those years without a win but then won the entire tournament in 2019 and strung together three wins in 2015. However, those seven wins are still good enough for a distant second place over the last five years while Kentucky has 13 in the same period, including four titles.
Kentucky’s dominance at the SEC Tournament has been even more so than their general dominance in regular-season results as they have ten more wins at the SEC tournament than everyone else over the last ten years and since 2000.
If I was making a guess before gathering all of this data, I definitely would not have had Mississippi state as the team with the third most SEC Tournament wins since 2000.
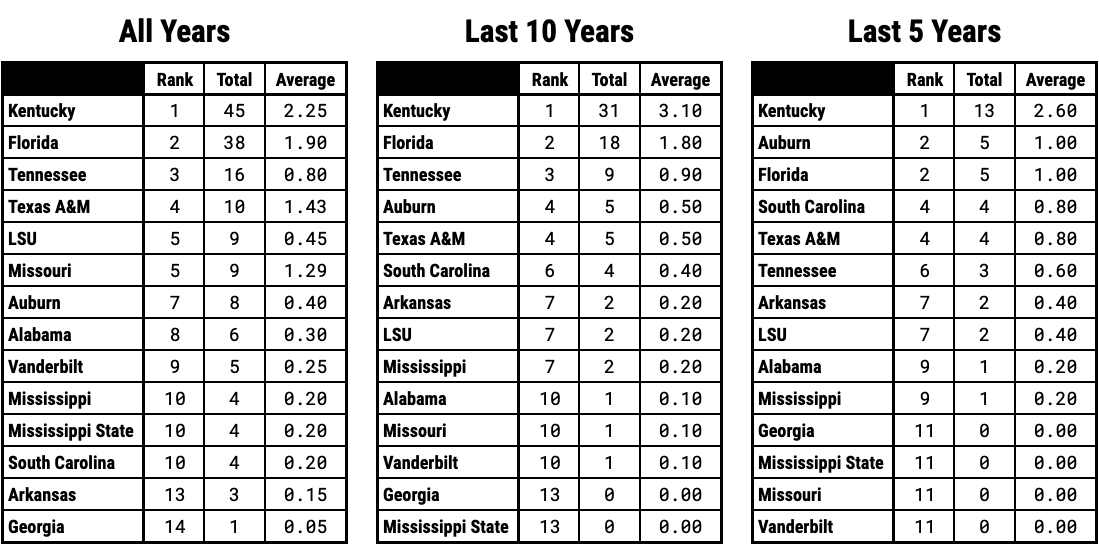
NCAA Tournament Wins
Looking at NCAA Tournament wins over the years is a good way to not only compare teams within the SEC, but also show which years the SEC has been successful as a conference overall.

Since the 2000 NCAA Tournament, the SEC has won three titles and made 11 total Final Fours.
Despite sending the eight teams to the 2018 NCAA Tournament, the SEC still only had eight wins overall and didn’t send any teams past the Sweet 16.
Arkansas, Georgia, and Mississippi State are the only schools to not win multiple games in a single NCAA Tournament since 2000.
South Carolina has zero wins in the NCAA Tournament since 2000 other than their 2017 run to the Final Four.

Georgia has the worst record since 2000 with just one win overall and no wins in the last ten years
Missouri has no NCAA Tournament wins since moving to the SEC in 2013 despite having the nine wins since 2000.
Florida has at least one NCAA Tournament in 13 of the past 20 years while Kentucky has at least one NCAA Tournament win in 17 of the last 20 years.
Postseason Status
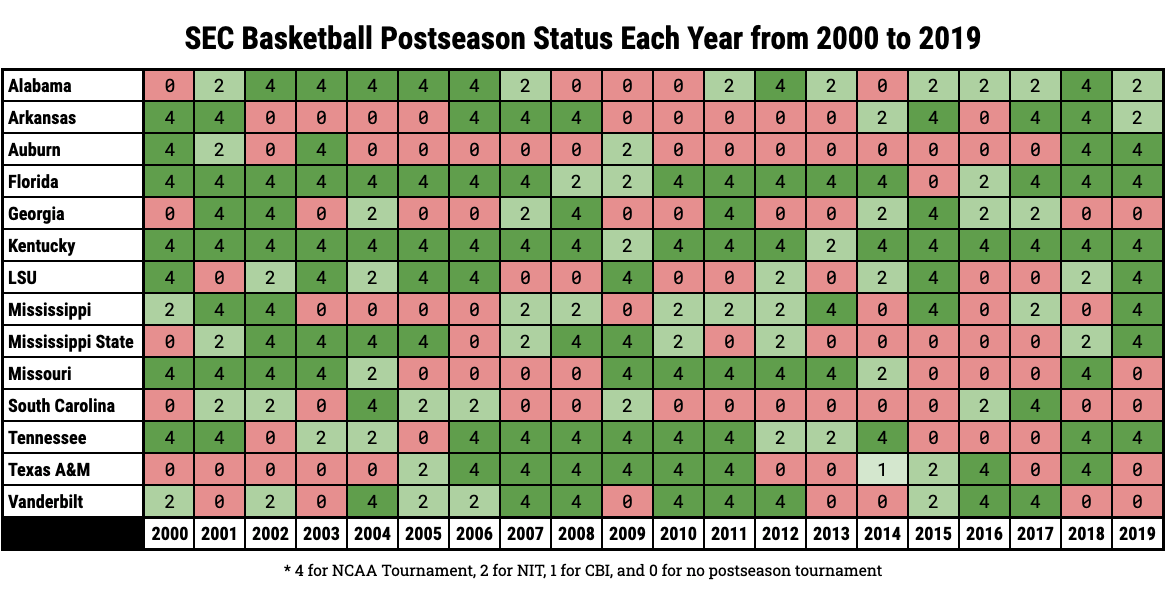
While wins in the NCAA Tournament are the best sign of success, just getting to the NCAA Tournament or a postseason tournament at all is seen as a successful season for just about every team in the conference.

Kentucky is the only team to make it to the postseason every year since 2000 and the Wildcats only went to the NIT in 2009 and 2013. Florida has similar success with the Gators only missing the postseason in 2015.
Auburn had the longest postseason drought by not qualifying for any postseason tournament from 2010 to 2017. An NIT appearance in 2009 prevented that from being an even longer drought from 2004 to 2017.
Along with that drought, Auburn also has the most seasons where they have failed to reach the postseason with 14 in the past 20 years. South Carolina also missed the postseason 12 years our of the last 20 and Arkansas had ten years with no postseason play to show for.
Alabama has the most NIT appearances with eight while Ole Miss is close behind with seven NIT trips in the last 20 years.
Only four SEC teams (Auburn, Florida, Kentucky, and Tennessee) currently have active NCAA Tournament streaks of more than one year.

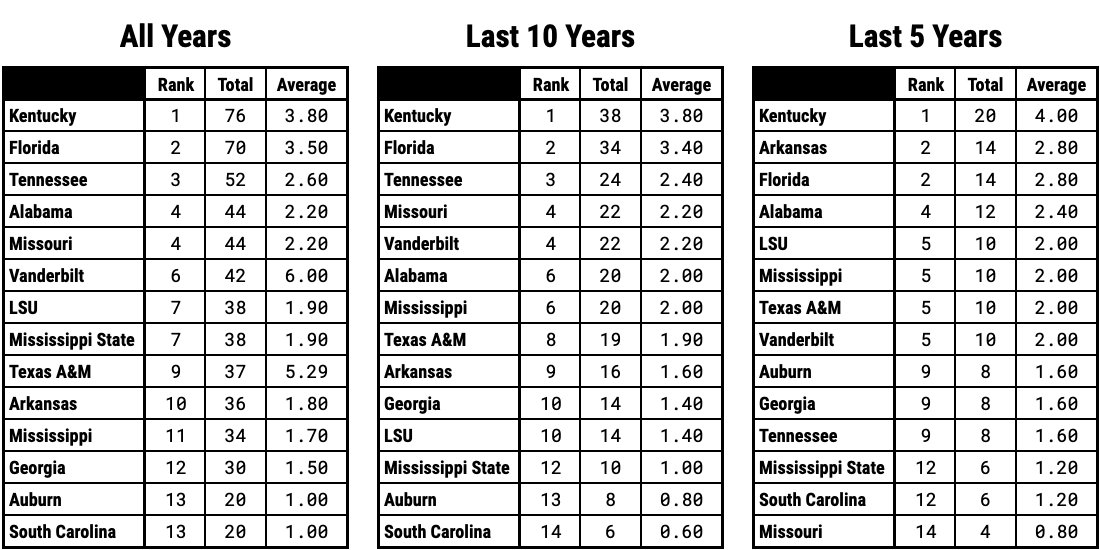
I tried to use four, two, and one as indicators for the postseason tournament that each team qualified for each year so that the averages would better reflect the success overall.
Kentucky and Florida are regular NCAA Tournament teams with them averaging 3.8 and 3.5 points respectively over the last 20 years. Several teams average out to be NIT teams over the last 20 years
This was mostly just an excuse for me to go back and look at historical stats while no real sports are going on, but it was a nice way to gather the data and look at the trends for success (and lack thereof) for each of the SEC teams.
I wanted to look at data since 2000 because I think it’s a large enough window to show ups and downs for most teams, but also recent enough to be more reflective of modern basketball.
Sometimes I feel like when success is measured across multiple decades, it tends to favor programs like Kentucky even more because a winning program, in the beginning, is able to build much more momentum and success overall due to the share of resources and talent they had in the beginning.
Looking just at the last 20-ish years certainly still shows that Kentucky is a dominant program and the gold standard of the SEC, but all programs should be on a much more level playing field for comparison.
I already have a plan to go back and compare teams based on all-time wins, tournament appearances, Final Fours, draft picks, and other “indicators of program success,” but that might take me a little longer to gather the information in one place to continue to make fun charts and graphics.
Like Black Lovell’s original inspiration for this, I’m just hoping that I can keep myself entertained in the absence of real basketball content and as a result, I plan to pass some of that entertainment onto others.
Thanks for reading, and feel free to let me know on Twitter if you notice other trends or things that stand out to you.