In this post, I explain how I use stats and different metrics to determine relative game performance and then award a most valuable player for each game as well as rank the overall contribution for each player in each game. As I explain throughout the post, each of these metrics offers a fun way to evaluate players in the context of singe games, single seasons, or entire careers.
The Idea
I got the idea of awarding a “Game MVP” statistically from Ken Pomeroy. However, unlike Pomeroy’s site, I award an MVP for every Auburn game, whether they win or lose. I don’t believe that Pomeroy indicates what combination of statistics he uses to decide which player is the MVP, but after using my criteria, I came to the same conclusion on Auburn’s MVP for almost all of their wins.
I wanted to have an MVP metric for Auburn so that I could keep track of players that have occasional big games, are consistently an important factor, or are either exceptionally good or exceptionally bad. While my stat is officially used to calculate the MVP of each game, it also goes ahead and ranks the performances of each player that sees the court in a game.
This is what allows me to calculate an “average MVP placement” for each game as well as track how many games a player finishes in the top 3 or top 5 of a game indicating that they were a major factor on the game or at least deserved to be a starter in that game (I realize that many things factor into determining starters and that some players contribute more off the bench for various reasons).
My Calculation
My method is rather simple, while the calculation is not. To award an MVP and assign relative performance rankings for each game, I just use the offensive contribution percentage for each player in the game. This metric is just each player’s Adjusted Game Score relative to the other players in the game on the same team.
Game Score is credited to John Hollinger and is a box-score-based metric that takes into account most individual stats in order to give a good measure of player productivity for the game. Adjusted Game Score just normalizes each player’s Game Score to reflect the actual points the team scored. The calculations I use are:
\[GameScore = Pts + 0.4*FGM - 0.7*FGA - 0.4*(FTA - FTM) \\ + 0.7*OREB + 0.3*DREB + STL \\ + 0.7*AST + 0.7*BLK - 0.4*PF - TOV\] \[AdjGameScore = \frac{GameScore}{TeamGameScore} * TeamPts\]Offensive Percentage is then just each Individual Adjusted Game Score as a percentage of the Team Game Score.
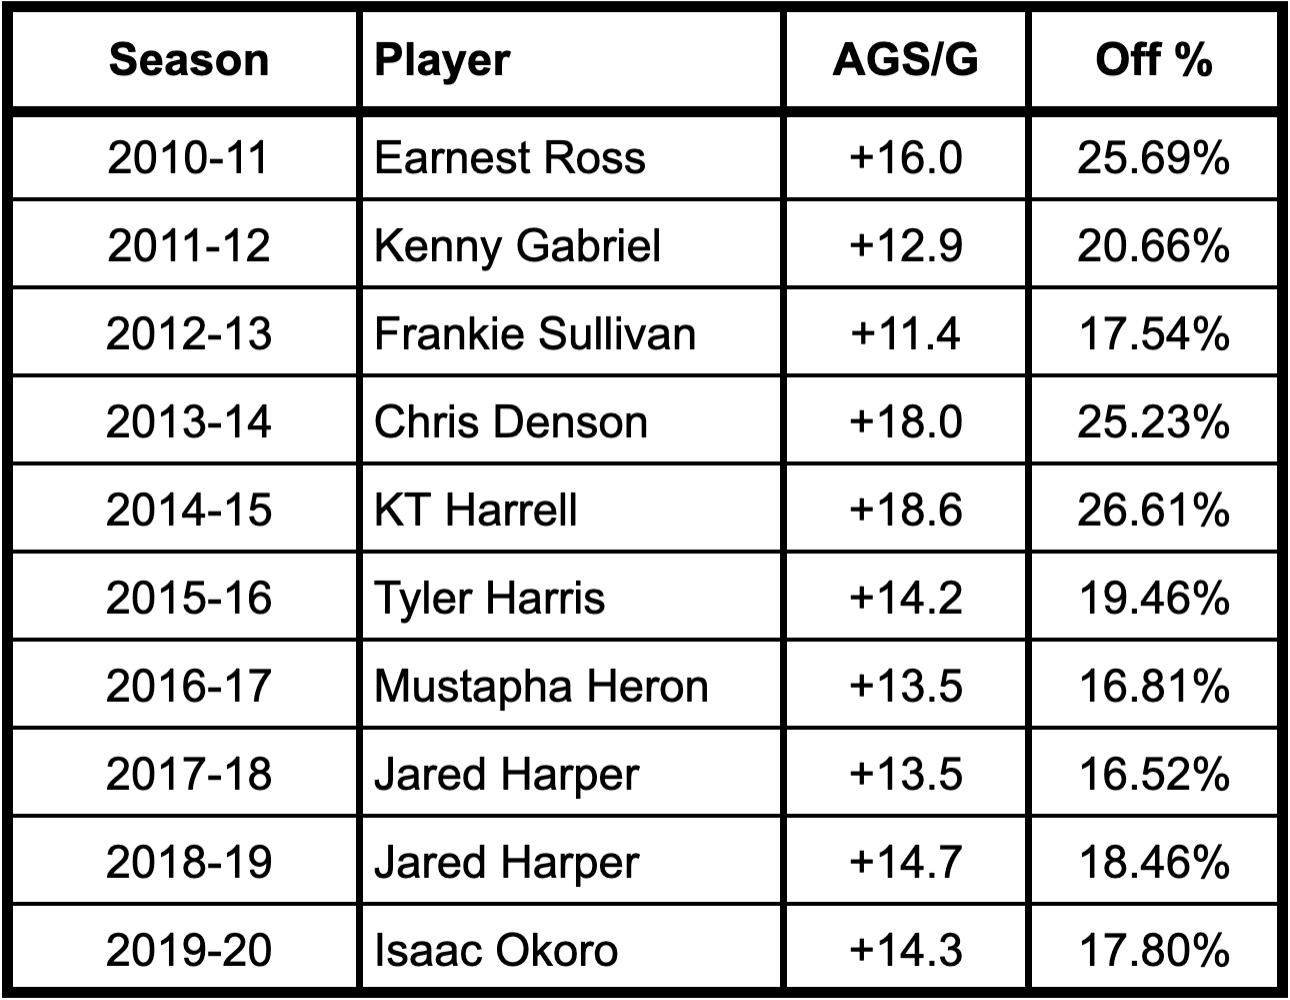
Auburn Basketball MVPs from 2010-2020
The reason I like the Offensive Percentage stat is because it can easily be extended to a full season to show who had the most contribution across all key stats throughout the year. While there can be other factors when voting on a player with the “eye test” or combining more stats that people find valuable, these are the MVPs for Auburn basketball over the last decade:
 Auburn Basketball Season
MVPs for 2010-2020
Auburn Basketball Season
MVPs for 2010-2020
Some things immediately stuck out to me when looking at the MVPs for the past ten seasons.
First, KT Harrell, as discussed in my post earlier was a major part in willing the 2014-2015 team to wins, even if they were infrequent. This immediately highlights that Offensive Percentage, like some other stats, can be greatly affected by the quality of other players on the team. The next best player on the 2014-2015 team was Cinmeon Bowers at 16.78%.
Second, Jared Harper was awesome (I can’t state this enough) and was obviously important to Auburn. Harper benefits here because he was a player that could do a little bit of everything, and that’s pretty much what is supposed to be reflected in Adjusted Game Score and Offensive Percentage. Along with doing lots of things well, Harper benefits from being one of the more consistent players, which I’ll touch on later when looking at game MVPs.
Some of the seasons were really close, like in 2011-2012 where Frankie Sullivan had an Offensive Percentage of 20.22% and only trailed Kenny Gabriel by 0.44% for the season MVP. Chuma Okeke was also less than a percent away from Jared Harper’s MVP season in 2018-2019 and the last two games could have made a difference since Offensive Percentage does not account for missed games when looking at a full season.
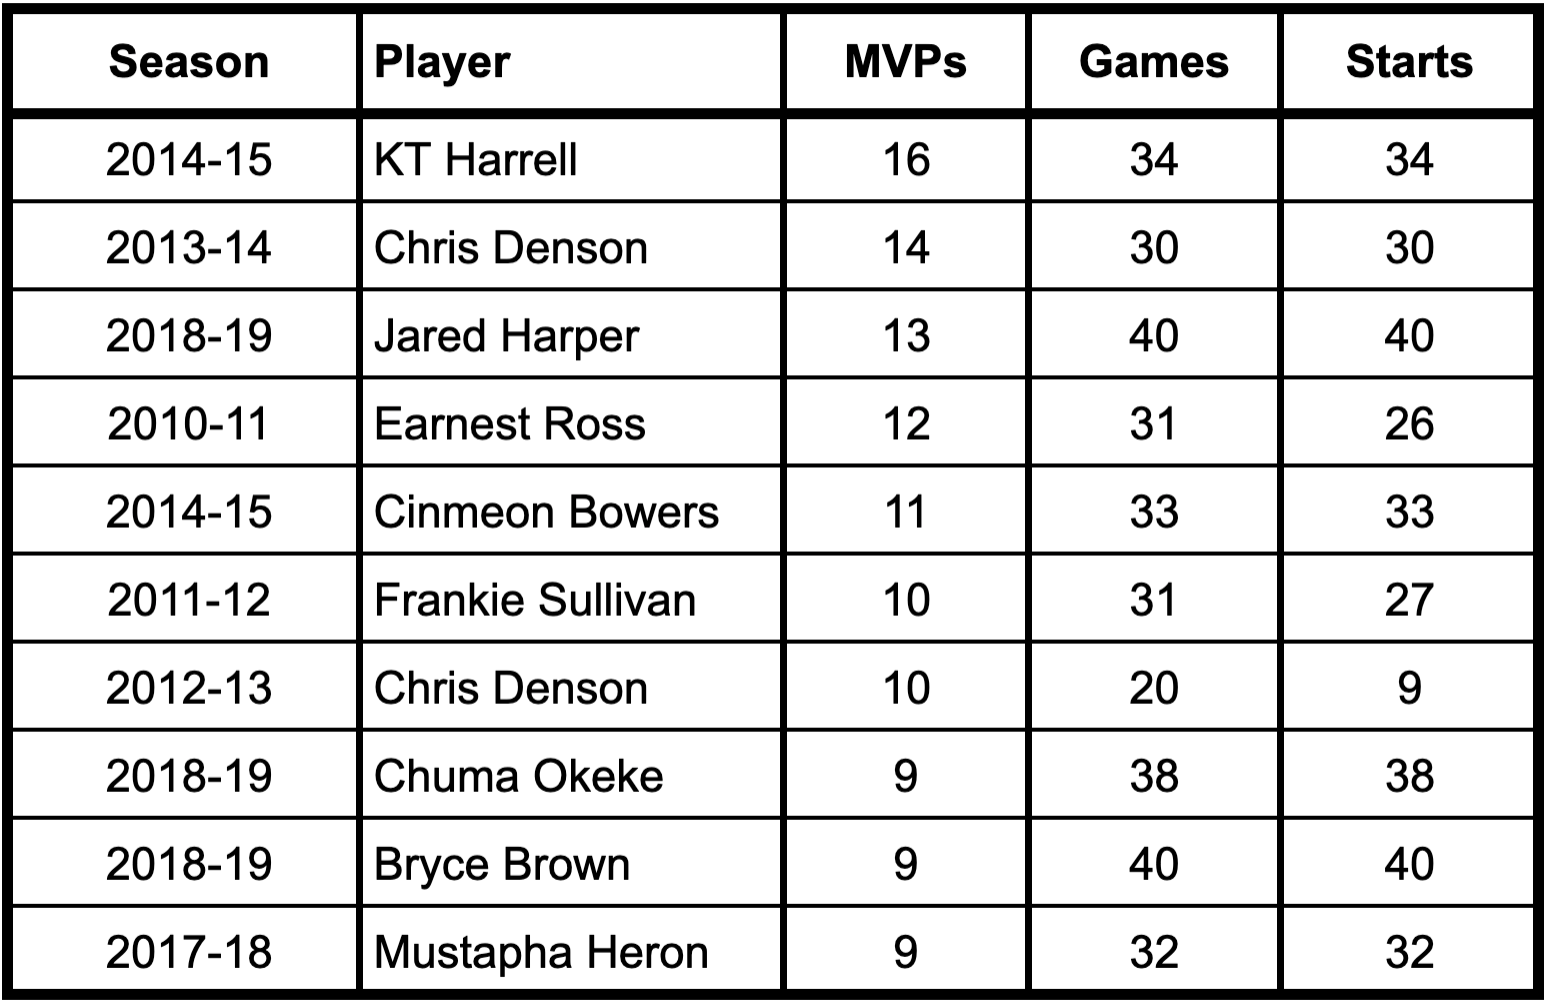
Most MVPs in a Season from 2010-2020
While Offensive Percentage certainly does a better job of showing consistency throughout the season, it’s also worthwhile to take a look at total number of games where a player was the best player in that individual game. Below are the ten highest MVPs in a season for players in the 2010-2020 seasons (no 2019-2020 players make the list because there have only been 24 games played at the time of writing this), as well as the number of games played and number of starts, which gives more perspective.
 Top Ten Game MVPs in a
Season for 2010-2020
Top Ten Game MVPs in a
Season for 2010-2020
The first thing that immediately stood out to me in this list was Chris Denson being the best player for Auburn 10 times in 2012-2013 despite only playing 20 games and starting 9 of them. Half of his MVP games, he came off of the bench. In the final three games of the season (all off the bench, and all game MVPs), Chris Denson posted Offensive Percentages of 40.26%, 40.17%, and 26.78%!
Cinmeon Bowers was a pretty good second option for the 2014-2015 team as he brought in 11 game MVPs, good for 5th in the past decade, despite being 13th in season Offensive Percentage in the same period. At first, I thought this stat was even weirder, but then realized that my Game Score stat that these are based off of was totally broken in a game where Bowers scored 17 points and pulled down 15 rebounds but Auburn still lost to Tulsa 35-53 and posted a team Game Score of -1.1.
You didn’t need a chart to tell you this, but Jared Harper, Bryce Brown, and Chuma Okeke were quite the three-headed attack in 2018-2019 with the three of them combining for 31 of the teams game MVPs and all three individually finishing in the top 10 for the last decade.
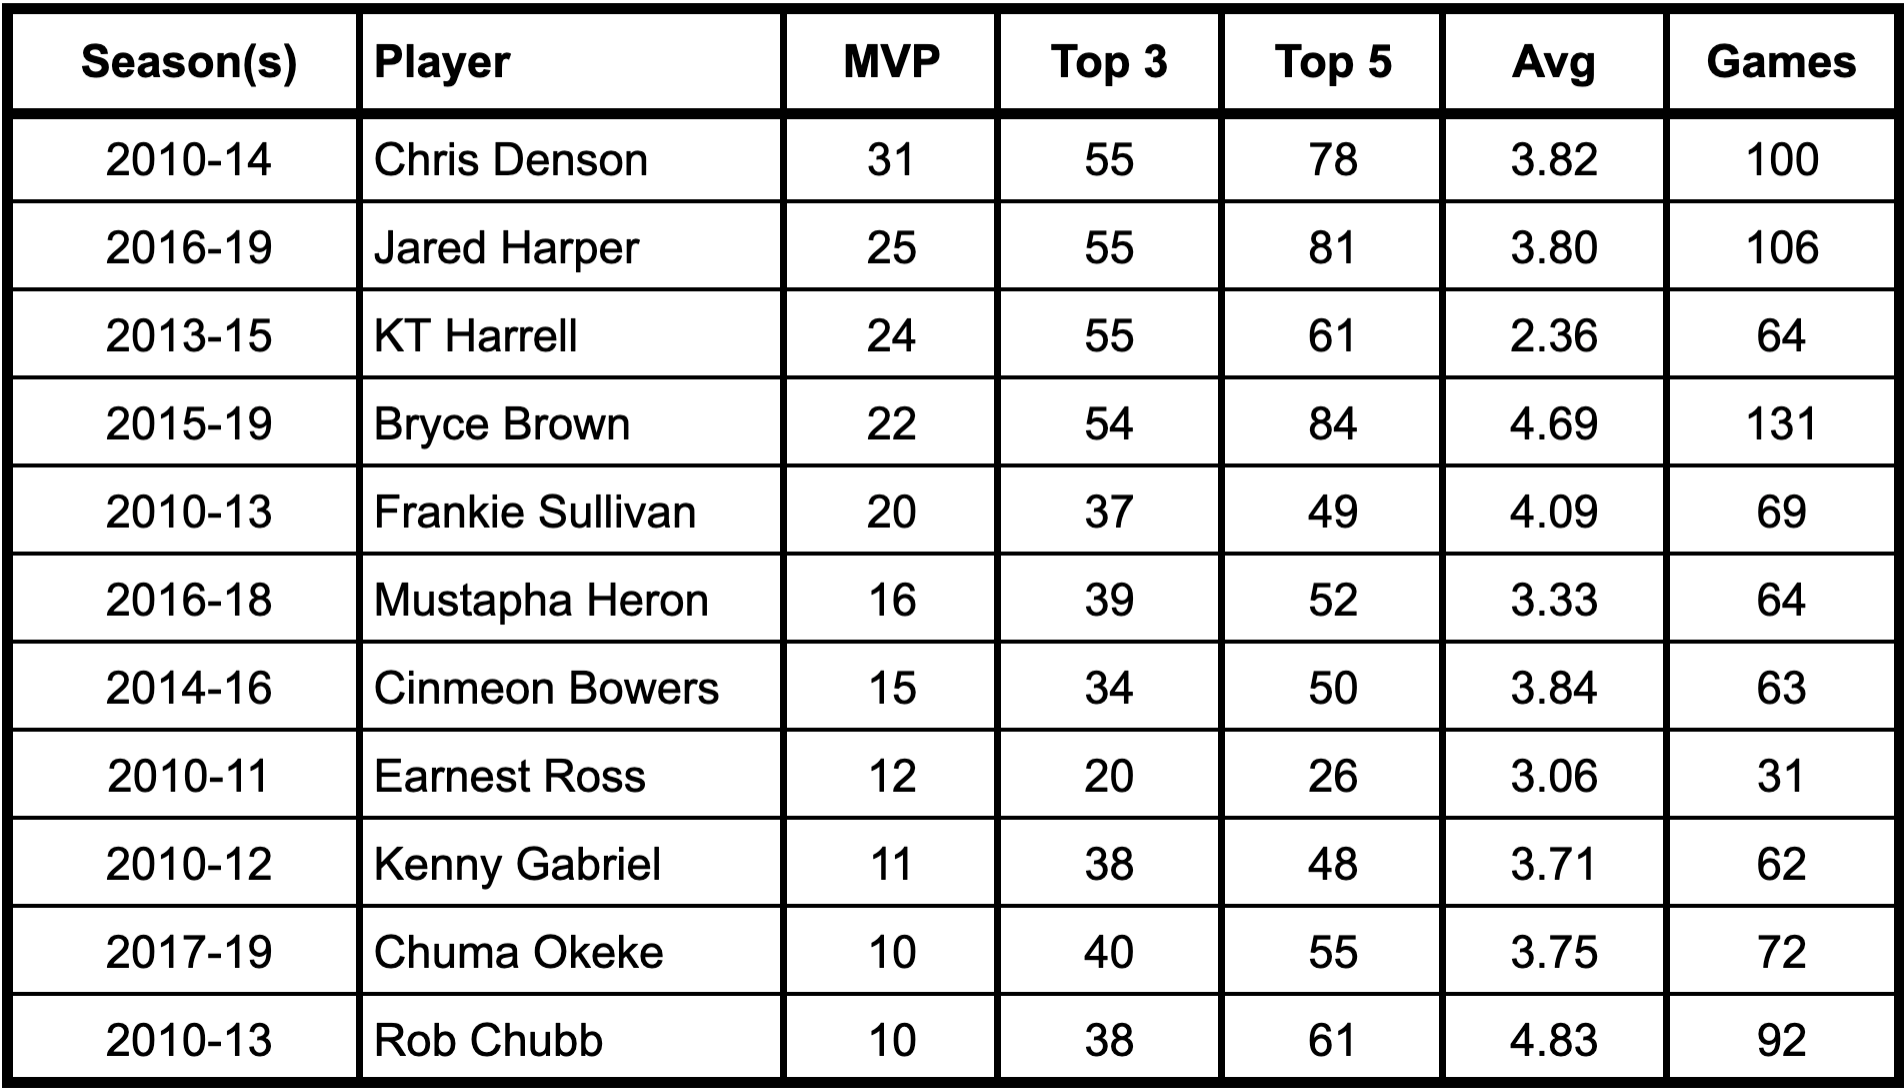
Total Game MVPs, Top 3s, and Top 5s
Another way I like to get a good overall picture is to look at the players that not only have the most MVPs, but also compare the number of times that they finish the game in the Top 3 or Top 5. The average placement, which has a best-case scenario of 1 (if the player was the MVP in every game they played in) and a worst-case scenario equal to the number of players on the roster that year. Here are the results for the players with double-digit game MVPs in the last decade:
 Most Individual Game MVPs
from 2010-2020
Most Individual Game MVPs
from 2010-2020
The table favors KT Harrell once again as the transfer guard gathered 24 game MVPs in just 64 games across his two seasons playing for Auburn. Harrell also finished just 3 of his 64 games outside of the top 5 players in a game, which is why he started all 64 games while he was at Auburn under both Tony Barbee and Bruce Pearl. Harrell also has the best average MVP placement for his career at 2.36.
Jared Harper posted 25 game MVPs, 55 games in the top 3, and 81 games in the top 5 which was good enough for second on this list. This is even more impressive considering Harper did this in just three years at Auburn and had the potential to most likely easily overtake Chris Denson if Harper had stayed for a senior season.
We all know that Bryce Brown could get hot, and that seemed to happen more frequently than not in his last two seasons at Auburn, but this stat shows that Brown also had his fair share of cold games with one of the lower average MVP placements on this list at 4.69. Brown still had the most games played in the decade and second-most games where he finished in the top 3.
As of this post, I have just finished adding team and individual game stats going back to the 2010-11 season, which means I now have stats for every Tony Barbee and Bruce Pearl coached teams. Stats and metrics like this were interesting to look at for the past decade, because they’re determined by a player’s skill as well as the overall talent on a team, which means players for both Tony Barbee and Bruce Pearl can show their relative worth to each of the teams they were on.
I hope this was another interesting metric and my explanations made sense. As always, if you have questions or want to see more of this data for other groups of players, just let me know on Twitter.
Thanks for reading and War Eagle!