The most essential advanced metrics that I (and a lot of people) use to judge teams are offensive and defensive efficiency. They’re both common metrics for comparing NBA teams and are also useful in college basketball, although, as with a lot of things, the unbalanced schedules in college cause there to be some caveats.
I don’t have near the amount of data as Ken Pomeroy or other bigger sites, so my offensive and defensive efficiencies (also called ratings) don’t factor in opponents, so they’re NOT adjusted efficiencies. This is not as big a deal when just looking at one team, but I’ll try to note when games are against either very good or very bad teams to put some of the more impressive wins into perspective.
Explaining Efficiencies and Possessions
Before I get too far into this, I want to give a basic explanation of offensive and defensive efficiency. In the most basic sense, each efficiency is just the number of points that the Auburn (for offensive efficiency) or their opponent (for defensive efficiency) scored if the game had had 100 possessions. This normalizes the ratings for teams or games that are faster or slower tempo.
As an example, a team that scores 90 points but has 80 possessions in a game isn’t as impressive as a team that scores 80 points with just 65 possessions in a game.
I plan on doing another post in the future going into the details of how I calculate possessions and other common metrics in my spreadsheet, but for now, possessions are just calculated using shots, rebounds, and turnovers for both teams, and then averaged out. This isn’t always exactly accurate because it’s just based on the box score, but it allows me to calculate possessions for games all the time even if actual possessions were not tracked.
Overview of my Graphs Used in this Post
Each of the graphs I use in this post all show the offensive efficiency, defensive efficiency, and net efficiency (offense minus defense) for each game of the season. I’ve also plotted a line that is a running average of the offensive and defensive efficiencies as the season progresses. With this, a game with higher offensive efficiency than defensive efficiency is a win for Auburn , and any games for both metrics above the average are “good” games at that point in the season.
The offensive efficiencies are in green while the defensive efficiencies are in red. The yellow line at the bottom is the net efficiency which shows whether Auburn won or loss if it is positive or negative, as well as the margin of victory or margin of defeat in a tempo-free way.
Since this is my first time using graphs with my stats, I’m open to feedback on things that can be better conveyed. Feel free to let me know on Twitter.
2019-2020 Season
Record: 20-2 (through 22 games)
Average Opponent KenPom Ranking: 98.18
Top 25 KenPom Opponents: 0
Top 50 KenPom Opponents: 5
Top 100 KenPom Opponents: 13
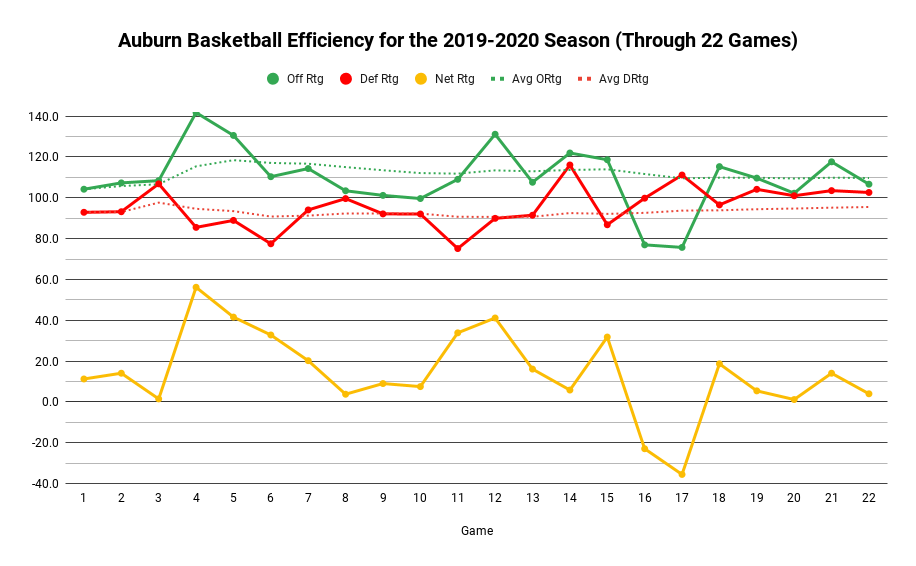
I’ve mentioned several times on Twitter that the Alabama and Florida games this season were major outliers. They’re two of the worst offensive games Auburn has played individually in the Bruce Pearl era and were the worst back-to-back games during his tenure. As a result, the net efficiency also takes a big dip in those games.
Another game of note is the win over Cal State Northridge where Auburn had the second-best offensive efficiency in the Bruce Pearl era with 141.7 points per 100 possessions as well as the fifth-best net efficiency at 56.2.
While this is the first season since 2015-2016 that the offensive efficiency for the season hasn’t improved on the previous year, the current season average for defensive efficiency is the best in the Bruce Pearl era by almost 5 points at 95.9 points per 100 possessions.
Currently, Auburn doesn’t have the best strength of schedule based on average KenPom ranking for opponents, but that should improve as Auburn continues to face above-average teams in conference play and hopefully has a longer post season similar to last season.
2018-2019 Season
Record: 30-10
Average Opponent KenPom Ranking: 69.44
Top 25 KenPom Opponents: 12
Top 50 KenPom Opponents: 19
Top 100 KenPom Opponents: 31
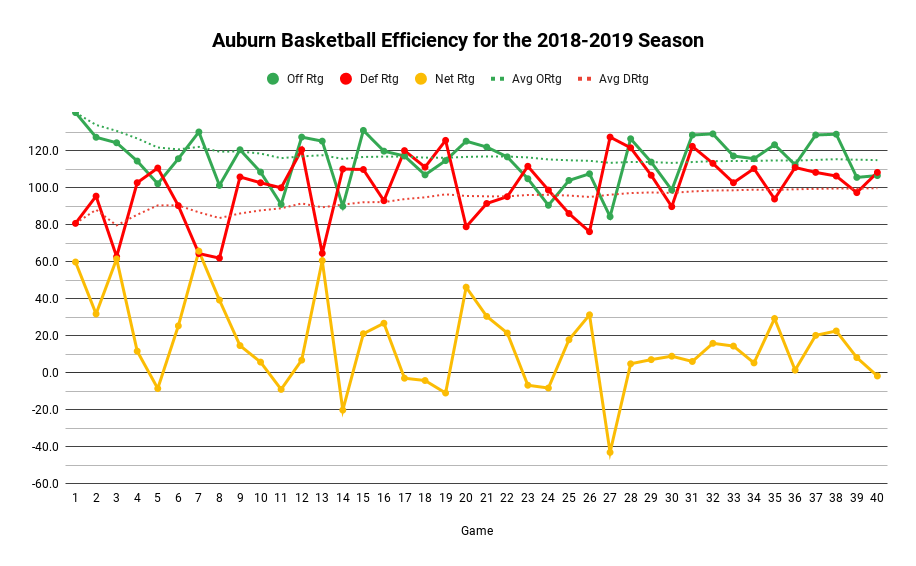
The 2018-2019 season was much more up or down, especially at the beginning of the season, and that can be seen by the very jagged lines for both offensive and defensive efficiency. However, the team got hot at the perfect time three games with over a 20 net efficiency in the SEC and NCAA Tournaments against Tennessee, Kansas, and North Carolina.
While the opponents certainly weren’t the toughest challenges, Auburn posted their two best defensive performances back to back against Saint Peter’s and UNC Asheville with defensive efficiencies of 64.5 and 62.0 respectively. The Saint Peter’s game was the best net efficiency performance in the Bruce Pearl era (albeit against a team ranked 235th in KenPom at the time) and the UNC Asheville game was the best defensive efficiency performance in the Bruce Pearl era.
The 140.7 offensive efficiency in the first game of the season against South Alabama is the second-best offensive performance in the Bruce Pearl era (against a team ranked 174 in KenPom at the time).
Overall, the 2018-2019 team posted the best offensive efficiency for a season in the Bruce Pearl era and the best defensive efficiency for a season up until this season. All of this was against the best overall set of opponents that Auburn has faced under Bruce Pearl thanks to an invite to the Maui Invitational and then a run through the SEC Tournament followed by a Final Four appearance.
2017-2018 Season
Record: 26-8
Average Opponent KenPom Ranking: 94.41
Top 25 KenPom Opponents: 4
Top 50 KenPom Opponents: 9
Top 100 KenPom Opponents: 22
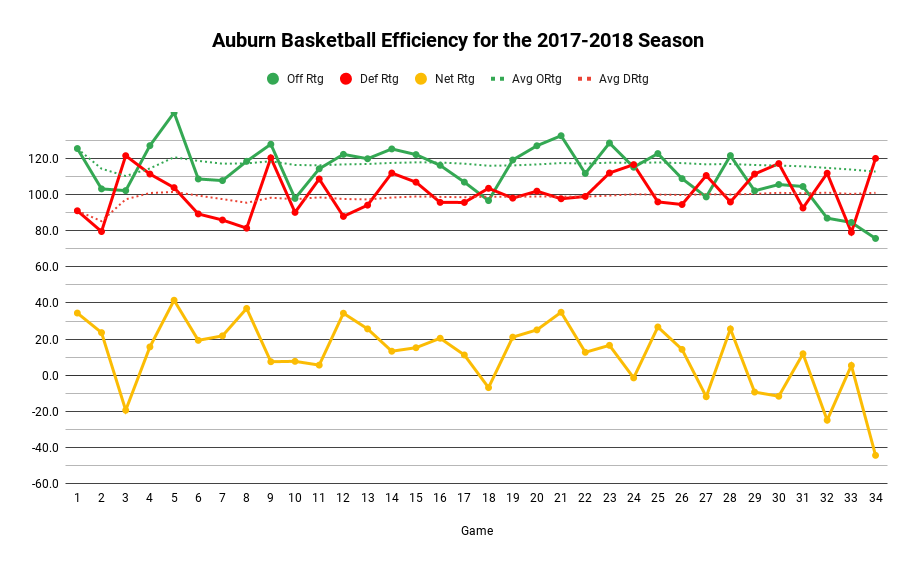
The 2017-2018 team was off to a similar start to the 2019-2020 team but then you can see where Anfernee McLemore went down with a season-ending injury in the 27th game against South Carolina.
Auburn’s best offensive game of the season came in game five against Winthrop where Auburn scored 145.3 points per 100 possessions. That game is also the best offensive game in the Bruce Pearl era.
Auburn posted its two best defensive performances in the second game of the season against Indiana State (79.5 points per 100 possessions), and the second to last game of the season against College of Charleston (79.1 points per 100 possessions). The College of Charleston game came at a perfect time which saved Auburn’s poor offense of just 84.6 points per 100 possessions and allowed Auburn to remain undefeated in opening round NCAA Tournament games.
2016-2017 Season
Record: 18-14
Average Opponent KenPom Ranking: 105.09
Top 25 KenPom Opponents: 3
Top 50 KenPom Opponents: 8
Top 100 KenPom Opponents: 20
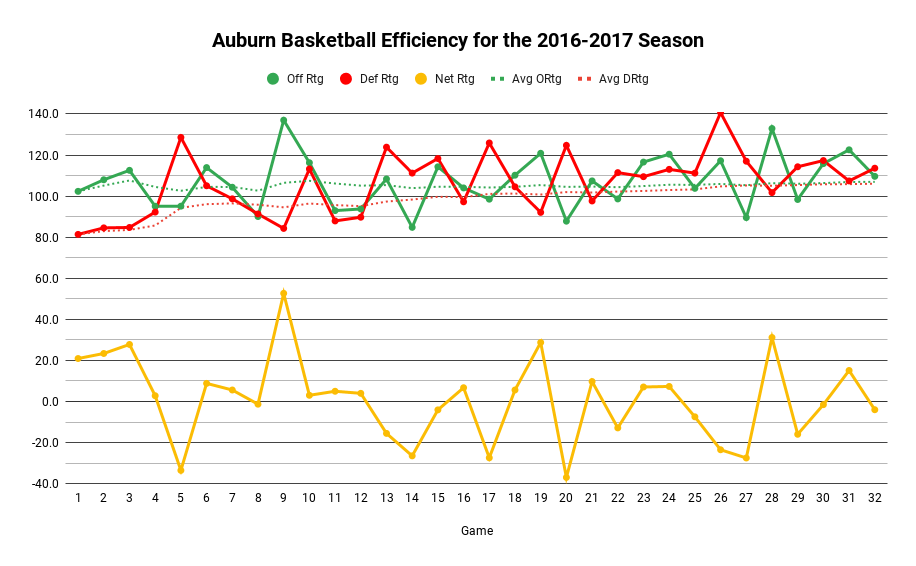
The 2016-2017 season was the first winning season under Bruce Pearl and the first winning season for Auburn since the 2008-2009 season under Jeff Lebo. Auburn may have had a winning record, but it was against Bruce Pearl’s worst set of opponents based on KenPom average ranking and was up and down almost the entire way.
Auburn’s biggest win of the year came against Coastal Carolina and former coach Cliff Ellis where Auburn posted a 137.0 offensive efficiency, 84.3 defensive efficiency, and 52.7 net efficiency.
The Florida game at home in the 26th game of the season was the second-worst defensive performance of the Bruce Pearl era where Auburn gave up a miserable 140.7 points per 100 possessions.
2015-2016 Season
Record: 11-20
Average Opponent KenPom Ranking: 88.97
Top 25 KenPom Opponents: 4
Top 50 KenPom Opponents: 7
Top 100 KenPom Opponents: 22
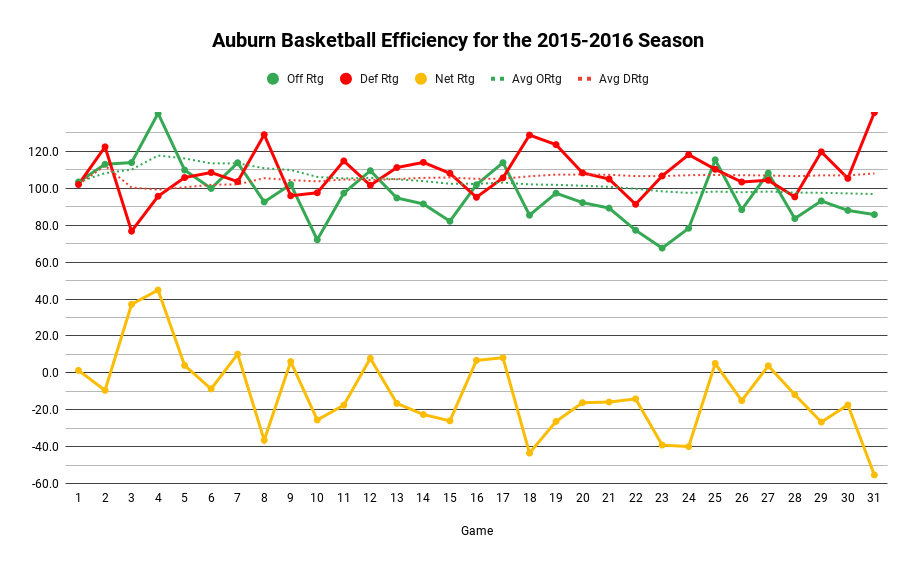
In 2015-2016, Auburn had probably the hardest regular season in the Bruce Pearl era with an average KenPom ranking of opponents of 88.97 without playing more than one postseason game. While the schedule didn’t present a lot of easy games, Auburn still finished with the worst record under Bruce Pearl and worst season record since Tony Barbee’s team in 2012-2013.
Despite a lot of bad performances on both ends of the court, Auburn still posted the third-best offensive performance under Bruce Pearl with 140.6 points per 100 possession against Northwestern State in the fourth game of the season. The game was the best offensive performance of the year and was 25.2 points per 100 possessions better than every other game for the rest of the season.
The very last game of the season was the worst defensively where Auburn gave up 141.0 points per 100 possessions against Tennessee in the first round of the SEC Tournament. The game was also the worst defensive performance by Auburn in the Bruce Pearl era.
2014-2015 Season
Record: 15-20
Average Opponent KenPom Ranking: 88.79
Top 25 KenPom Opponents: 4
Top 50 KenPom Opponents: 15
Top 100 KenPom Opponents: 21
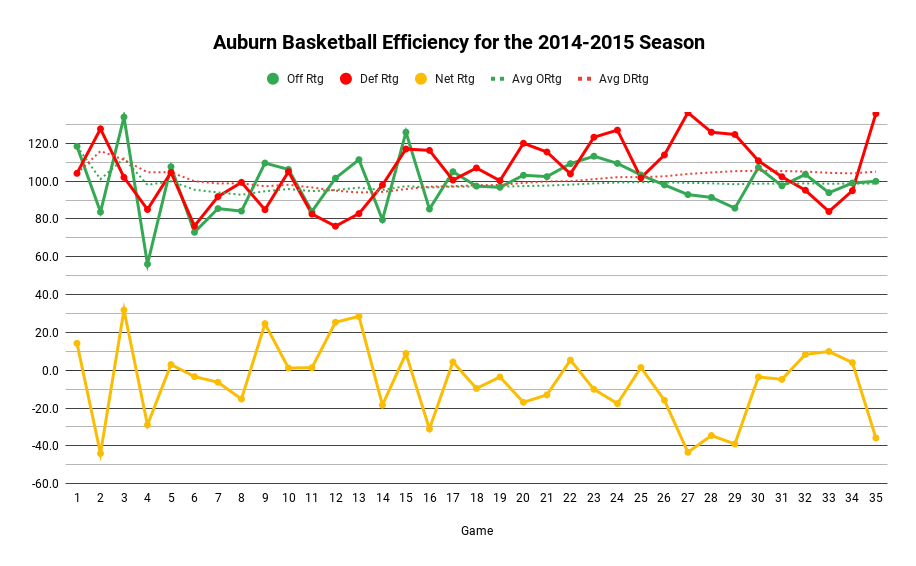
If you look at the averages for offensive and defensive efficiency as the year went on, it’s pretty clear that the 2014-2015 team was pretty even on both ends of the court but couldn’t put both sides together very often (until the end of the year).
Right before the end of the regular season, Auburn posted four straight games with offensive efficiencies below 100. It looked like it was going to be a rough ending for Bruce Pearl’s first season at Auburn.
However, the Tigers turned up the defense in the SEC Tournament with three games at 95.2, 84.0, and 95.0 points allowed per 100 possessions on the way to wins over Mississippi State, Texas A&M, and LSU. Those would be the first wins in the SEC Tournament for Auburn since the 2008-2009 season under Jeff Lebo.
Auburn ran out of gas and met the then-undefeated Kentucky Wildcats and their net efficiency took a nose dive to end the season in the SEC Tournament Semifinal.
Again, I think offensive and defensive efficiency are two of the best stats for judging teams on a level playing field without overhyping defenses that play slow or offenses that play fast. I hope the metrics make sense and help paint an overall picture for both sides of the ball under Bruce Pearl at Auburn.
As always, if you have any questions about specific data points or explanations in this post, please don’t hesitate to reach out to me on Twitter. Thanks for taking the time to read my overview of Auburn basketball offensive and defensive efficiencies under Bruce Pearl and I hope the graphs made it more interesting.
War Eagle!