So the idea/reason for this post goes back to a few tweets I had earlier this month about the individual win-loss records for Auburn basketball players so far this season:
Assuming I have the calculation right, I'm getting the following individual W-L for this year's Auburn major contributers so far:
— Jacob Varner 👨💻 🏀 🌮 (@jacobvarner) January 20, 2020
Doughty: 1.82 - 0.91
Okoro: 2.09 - 0.39
McCormick: 1.66 - 0.87
Purifoy: 1.59 - 0.43
Wiley: 2.07 - 0.14
McLemore: 1.49 - 0.15
I tried to explain the calculations in a general sense on Twitter, but it’s difficult, even in even a series of tweets, so I’m going to attempt to explain it and some other related stats here while also diving more into this data for the entire Bruce Pearl era and looking at some interesting standouts.
Individual Win-Loss Records Explained
I got the concept of individual win-loss records from advanced analytics pioneer Dean Oliver, and specifically his book “Basketball on Paper.” Oliver is mostly associated with the NBA, and so some things don’t directly translate to college, especially in the context of one team, in my case.
Anyways, in my most basic explanation, individual win-loss records are supposed to show how much each player contributed to the wins and losses of the season. The best players should contribute more wins and less losses. While not practical, I like to think of this stat as showing what a teams record would be if you just had five of that one player playing all season.
Oliver’s stat takes into account two main things: the individual winning percentage for a player and the individual contributions to games the player has. Individual winning percentage is fairly easy to calculate, assuming you already have the individual offensive and defensive ratings for the player (those are fairly complicated, but you can read about them here or in Oliver’s book I just mentioned).
The simplest version of individual win percentage, which Oliver credits to Bill James, is:
\[IndWin\% = \frac{ORtg^2}{ORtg^2 + DRtg^2}\]The “games responsible for” stat is a little more complex, and I had to make some slight modifications to make it fit Auburn and the data that I have available to me. Oliver uses four different metrics, percentage of team offensive possessions contributed to, percentage of team defensive stops made, percentage of team minutes played, and the percentage of team games started. Oliver gives more weight to the first two for reasons he explains in his book.
When I was getting these to work for Auburn, I found that the percentage of games started skewed the data too much since Auburn plays a 30–40 game schedule versus the NBA 82 game minimum. I also figured this portion was accounted for enough with the percentage of minutes played.
So for my final adaption of the formula, I calculated games contributed to as:
\[GmResp = \frac{3*OffPoss\% + 3*DefStop\% + Min\%}{7} * TotalGames\]Both the percentage of offensive possessions and percentage of team defensive stops are factored into ORtg and DRtg, so their explanation is covered in the link above.
Lastly, the individual win-loss record is simply calculated as:
\[IndWins = GmResp * IndWin\%\] \[IndLosses = GmResp * (1 - IndWin\%)\]I’m by no means an expert, and have never been a teacher, so that’s the best I think I can do in explaining the stat to others. As with almost any of my stats I use or reference, feel free to leave a comment below or reply on Twitter and I’ll do my best to explain it further if I can.
Individual Win-Loss Records for Auburn Players
To get a sense of what the stat looks like with actual data behind it, here are the individual results for the past two seasons:
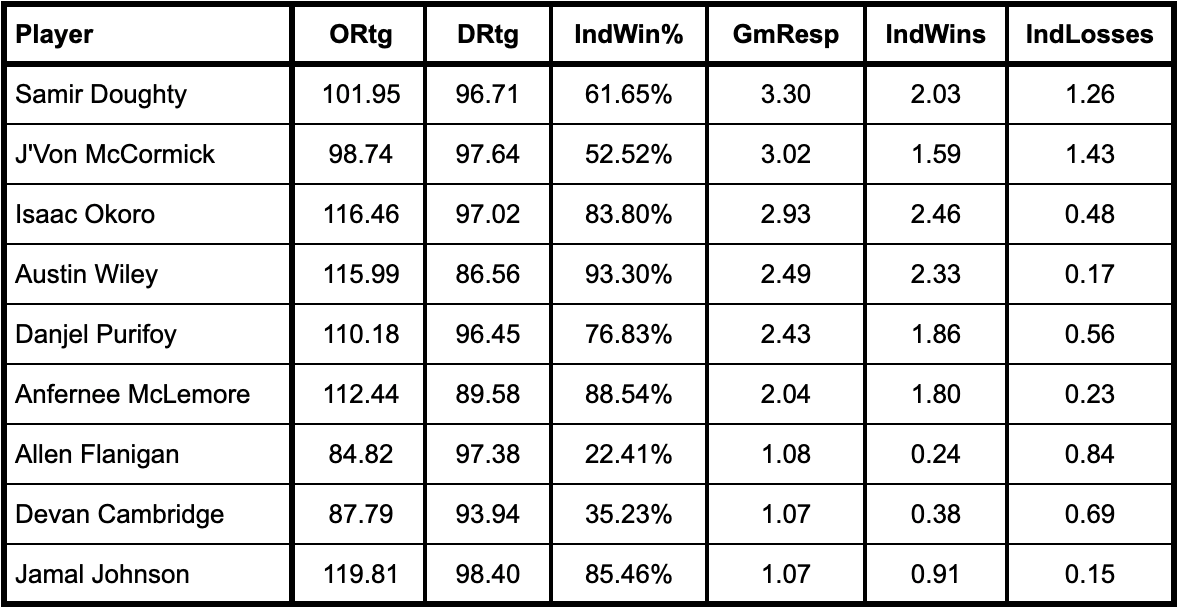 2019-2020 Season (Through 20 games)
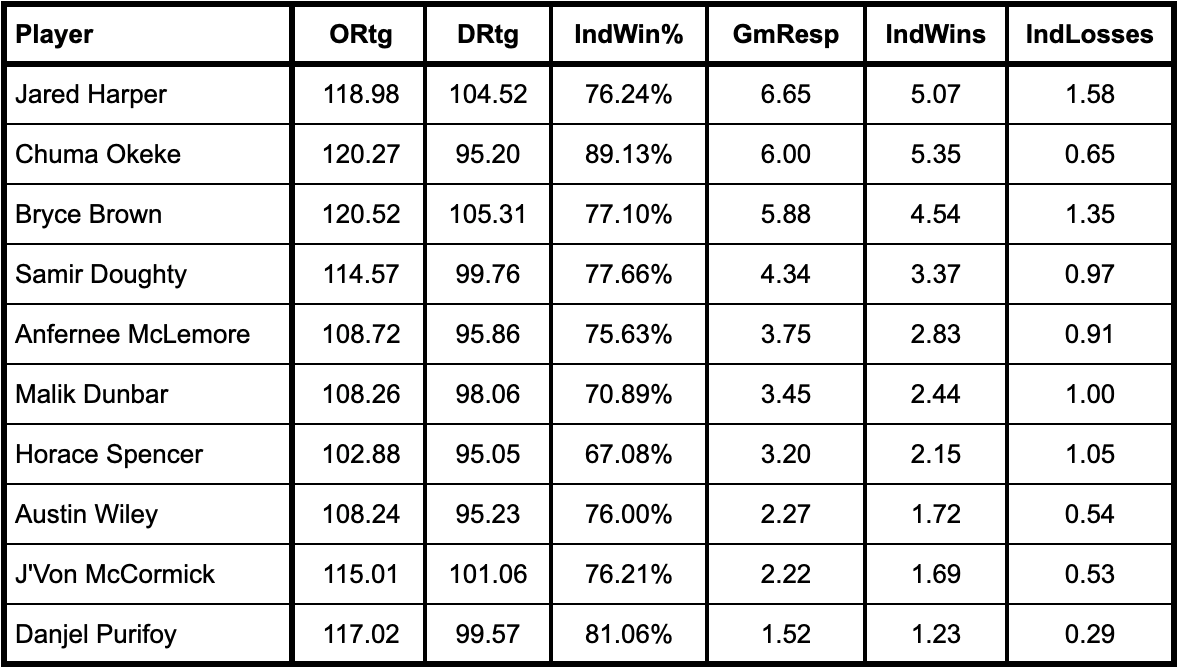 2018-2019 Season (40 games)
I’ve sorted each of these tables by the games responsible for, and they should be in order of the most impactful player, whether they contribute in a good way or bad way, they’re making the most contribution.
Looking at the 2019–2020 season, the first thing that jumps out to me is how good Isaac Okoro and Austin Wiley have been. Both are the top two in individual wins and near the bottom in individual losses.
This stat is best used on a season to season basis because it is heavily dependent on the other players playing around a single player and the overall success of the team that year. Because of that, I went on to come up with my own stat to better assess players from year to year and I’m tentatively calling in win contribution and loss contribution.
Win (Loss) Contribution Explained
My concept of individual win contribution and loss contribution is simply the individual wins (losses) divided by the team wins (losses) for that season. In my mind, I expected this to highlight good players on bad teams, and the data for the Bruce Pearl era seems to support that, as you’ll see eventually.
If you’re familiar with NBA advanced stats, this probably sounds very familiar to Win Shares. Win Shares are also pretty complicated, but if you’re interested, they’re explained fairly well here.
The reason I do not calculate Win Shares is mainly because they (like other advanced NBA stats) rely on a value for league averages in a few key stats. Because the NBA is a 30 team league, averages are pretty readily available. If I was using this for college stats, I could use an SEC average or an entire NCAA average, but I don’t think that is very practical and would have a lot more caveats due to unbalanced schedules and the parity of the team’s schedule.
Anyways, win contributions and loss contributions are my way of showing these same ideas just in the context of Auburn basketball.
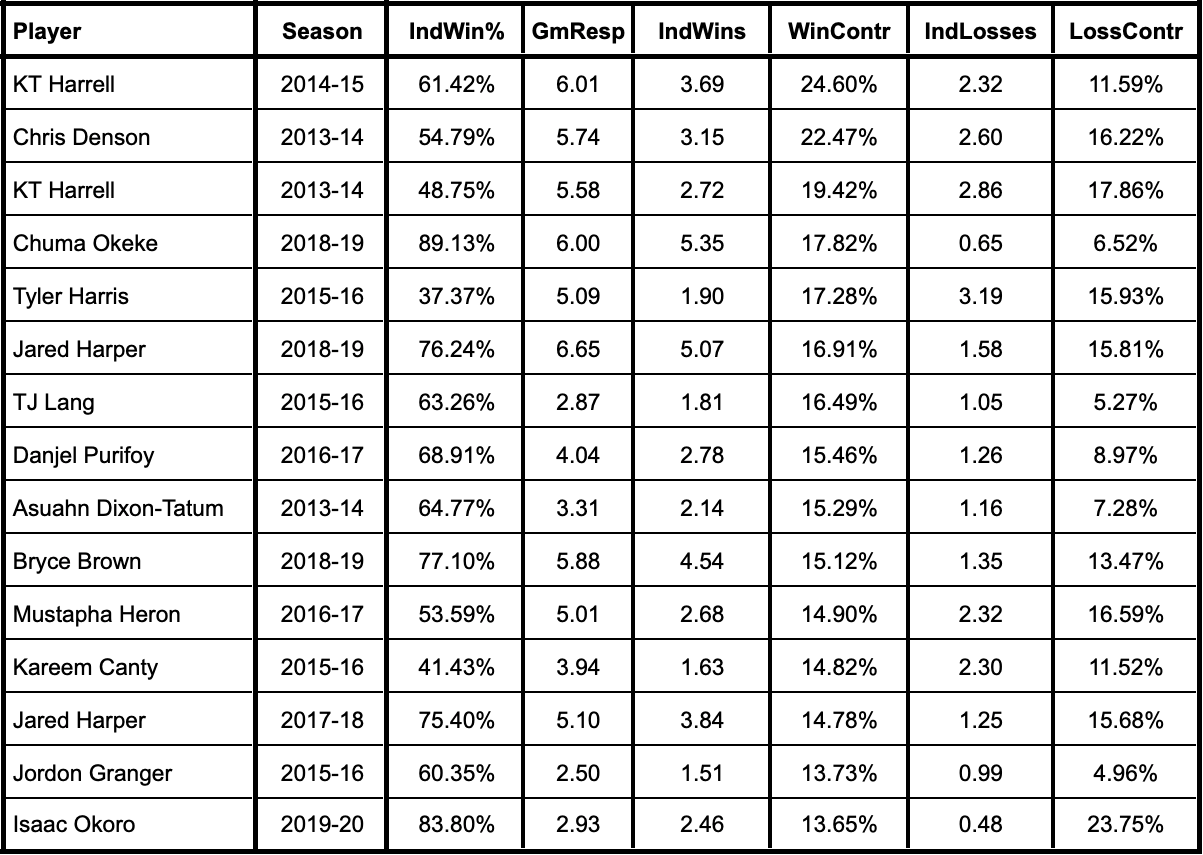
Win Contributions for the Bruce Pearl Era
Like I mentioned above, win contribution tends to be a good stat for accounting for good players on bad teams as shown by KT Harrell having the highest win contribution in the Bruce Pearl era. It also is another way of looking at the “best” player on a certain team, but this isn’t always accurate because typically the better players also contribute a lot more and are therefore going to also have more individual losses associated with them.
Below are the top 15 players by win contribution for the entire Bruce Pearl era, plus the final year of Tony Barbee’s tenure:
 Top 15 win
contribution percentages from 2013-2020
Top 15 win
contribution percentages from 2013-2020
Obviously, the 2013–2014 and 2015–2016 seasons were so bad that three and four different players respectively managed to make the top 15 in this list because no matter how many individual wins they had, dividing by 14 and 11 is going to lead to a high percentage.
The dominance of the big three (Chuma Okeke, Jared Harper, Bryce Brown) from 2018–2019 is also fairly evident because they still managed to all make this list despite the team winning 30 games that season. This stat would also probably be even more impressive for Chuma since he missed 2 of the games that are still counted against him in win contribution and games responsible for.
Also of note, Isaac Okoro is on pace to match Chuma Okeke and stay well under one individual loss for the season, which is not something that many players that play significant minutes can say. TJ Lang and Jordon Granger, the only other players to have less than 1 individual loss for the season played 62.0% and 53.5% of team minutes in 2015–2016.
I hope this post sparks some interest in others and does a good enough job of explaining the basis for the stat for those that were confused when I mentioned in originally. I also plan to start keeping tabs on this more as the season progresses and will certainly look back at where Isaac Okoro can sit on this least by the end of the season.
This is the first post of me explaining some of the more involved stats I calculate and Tweet about, but if you have any others in the past or future that you have questions about, let me know and I might dedicate a full post to them as well. I also plan on doing more visual analysis soon.
Thanks for reading, and hopefully my stupid obsession with numbers isn’t too boring.
War Eagle.